Pre-prepared plots of PupillometryR data
Source:R/plot_pupil_data.R
plot.Pupil_test_data.Rd
The plot functions are designed to run with just data and pupil selections, with some additional options for fun with plotting. To see these plots, you must first use one of the run_functional tests.
# S3 method for Pupil_test_data
plot(x, show_divergence = TRUE, colour = "black", fill = "grey", ...)
Arguments
- x
-
A Pupil_test_data dataframe
- show_divergence
-
logical indicating whether divergences are to be highlighted
- colour
-
string indicating colour of geom_line, passed to ggplot2
- fill
-
string indicating fill hue of divergence highlights, passed to ggplot2
- ...
-
Ignored
Value
A ggplot object
Examples
Sdata <- make_pupillometryr_data(data = pupil_data,
subject = ID,
trial = Trial,
time = Time,
condition = Type)
regressed_data <- regress_data(data = Sdata, pupil1 = RPupil, pupil2 = LPupil)
mean_data <- calculate_mean_pupil_size(data = regressed_data,
pupil1 = RPupil, pupil2 = LPupil)
base_data <- baseline_data(data = mean_data, pupil = mean_pupil, start = 0, stop = 100)
#> Baselining for each subject and trial. If this is not the intended behaviour you may wish to do this manually.
differences <- create_difference_data(data = base_data,
pupil = mean_pupil)
#> Hard minus Easy -- relevel condition if this is not the intended outcome
spline_data <- create_functional_data(data = differences, pupil = mean_pupil, basis = 10, order = 4)
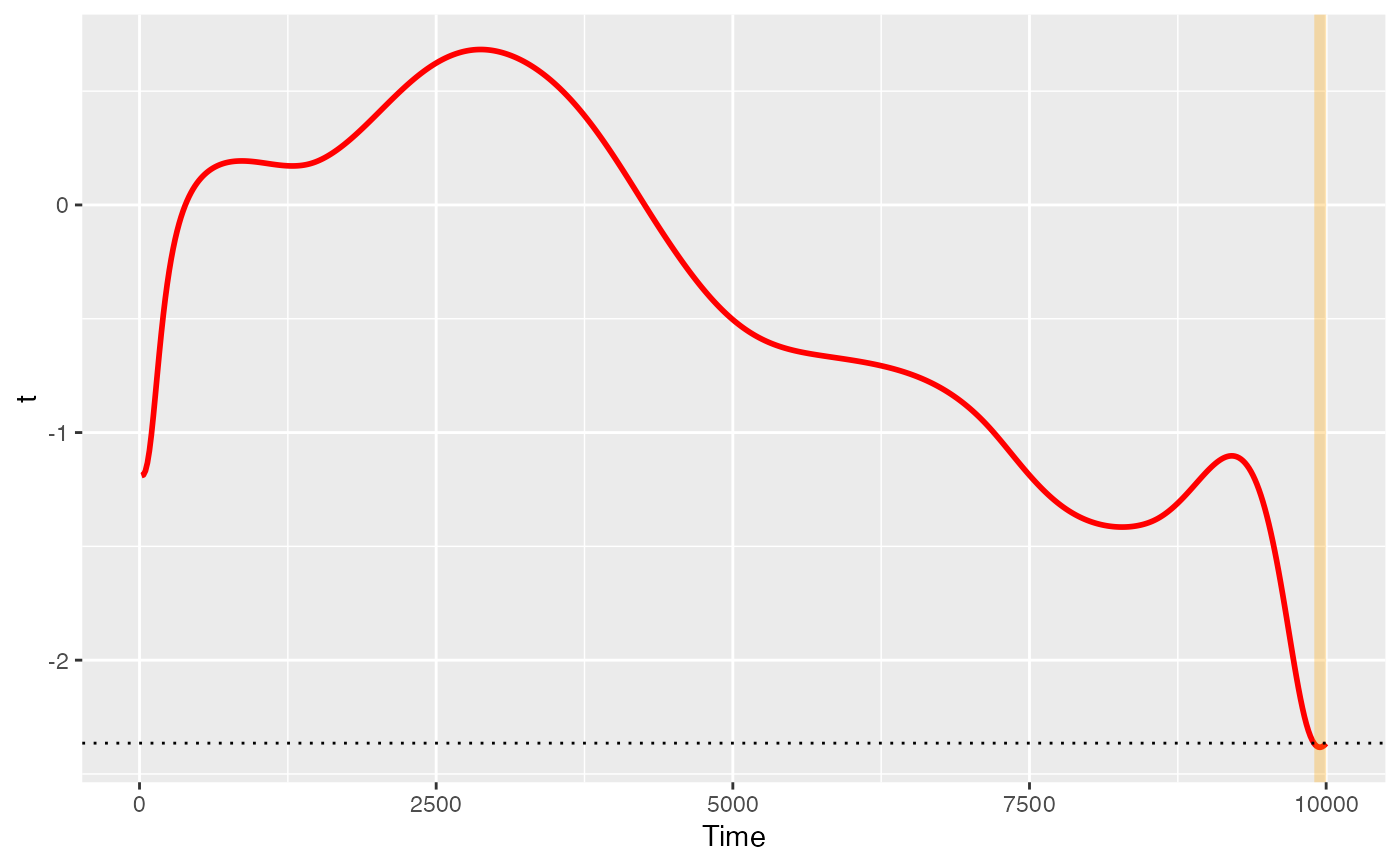
ft_data <- run_functional_t_test(data = spline_data,
pupil = mean_pupil)
#> critical value for n = 8 is 2.36462425159278
p <- plot(ft_data, show_divergence = TRUE, colour = 'red', fill = 'orange')
p