Pre-prepared plots of PupillometryR data
Source:R/plot_pupil_data.R
plot.Pupil_window_data.Rd
The plot functions are designed to run with just data and pupil selections, with some additional options for fun with plotting. To see these plots, you must first use create_window_data.
# S3 method for Pupil_window_data
plot(
  x,
  pupil,
  windows = c(FALSE, TRUE),
  geom = c("raincloud", "violin", "boxplot"),
  ...
)
Arguments
- x
-
A Pupil_window_data dataframe
- pupil
-
Column name of pupil data to be plotted
- windows
-
Whether you want to include time windows in the plot - logical
- geom
-
violin plots or boxplots. The newest version adds raincloud plots using Ben Marwick's flat violin plot.
- ...
-
Ignored
Value
A ggplot object
Examples
Sdata <- make_pupillometryr_data(data = pupil_data,
subject = ID,
trial = Trial,
time = Time,
condition = Type)
regressed_data <- regress_data(data = Sdata, pupil1 = RPupil, pupil2 = LPupil)
mean_data <- calculate_mean_pupil_size(data = regressed_data,
pupil1 = RPupil, pupil2 = LPupil)
base_data <- baseline_data(data = mean_data, pupil = mean_pupil, start = 0, stop = 100)
#> Baselining for each subject and trial. If this is not the intended behaviour you may wish to do this manually.
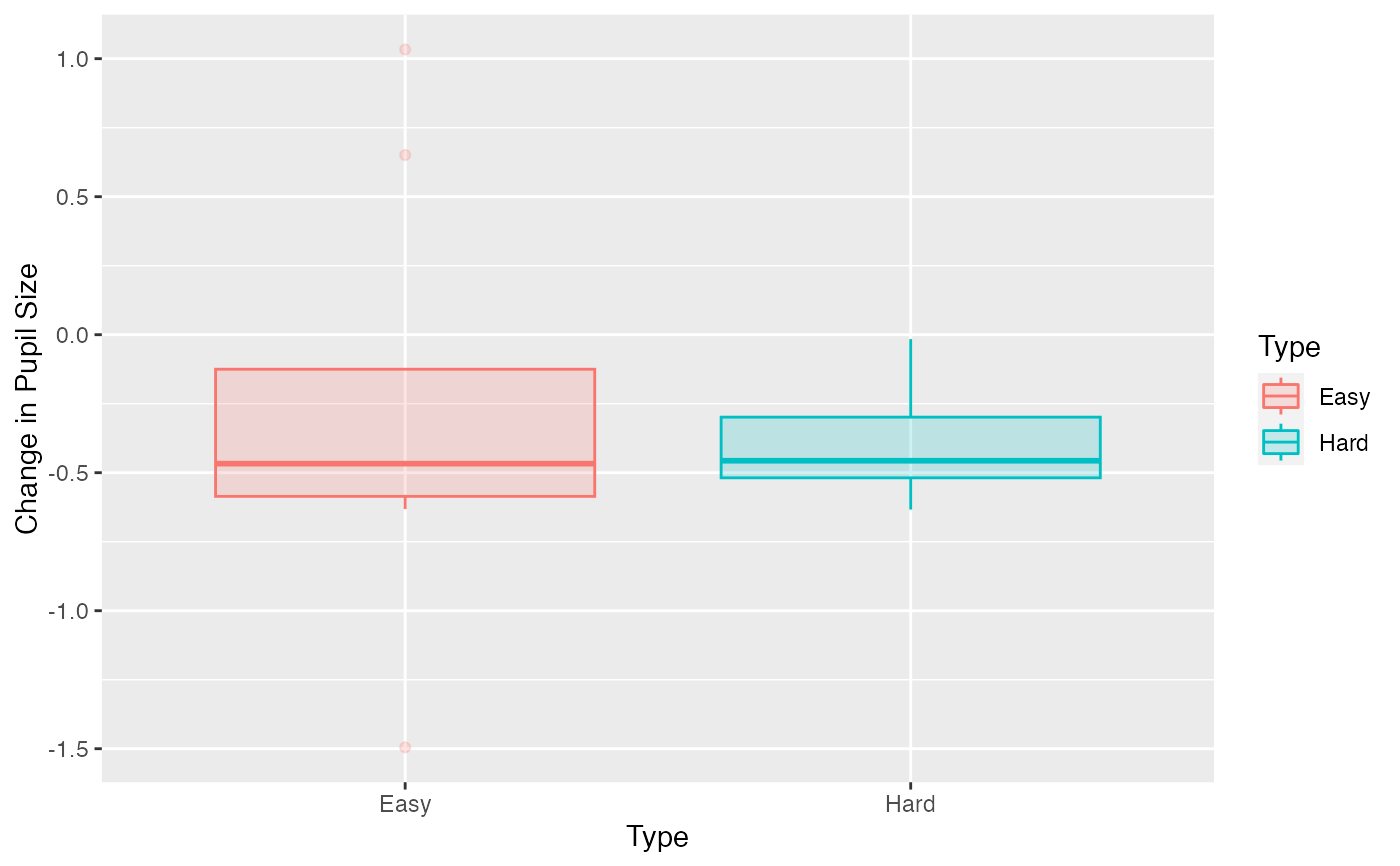
window <- create_window_data(data = base_data,pupil = mean_pupil)
p <-plot(window, pupil = mean_pupil, windows = FALSE, geom = 'boxplot')
p