The plot functions are designed to run with just data and pupil selections, with some additional options for fun with plotting. To see these plots, you must first use create_difference_data.
Arguments
- x
A Pupil_difference_data dataframe
- pupil
Column name of pupil data to be plotted
- geom
string indicating whether made of connected points or a line
- colour
string indicating colour of geom, passed to ggplot2
- ...
Ignored
Value
A ggplot object
Examples
Sdata <- make_pupillometryr_data(data = pupil_data,
subject = ID,
trial = Trial,
time = Time,
condition = Type)
regressed_data <- regress_data(data = Sdata, pupil1 = RPupil, pupil2 = LPupil)
mean_data <- calculate_mean_pupil_size(data = regressed_data,
pupil1 = RPupil, pupil2 = LPupil)
base_data <- baseline_data(data = mean_data, pupil = mean_pupil, start = 0, stop = 100)
#> Baselining for each subject and trial. If this is not the intended behaviour you may wish to do this manually.
differences <- create_difference_data(data = base_data,
pupil = mean_pupil)
#> Hard minus Easy -- relevel condition if this is not the intended outcome
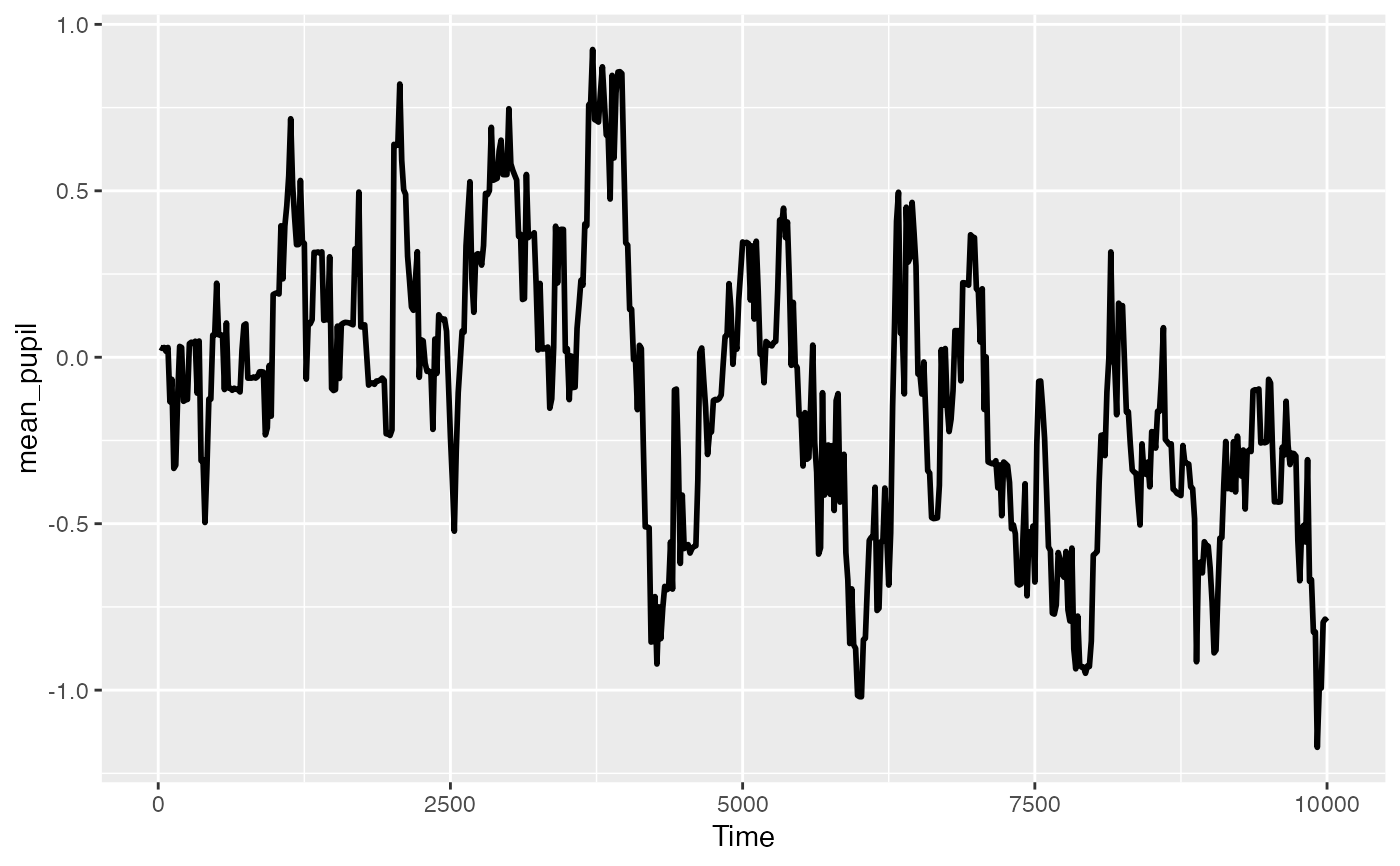
p <- plot(differences, pupil = mean_pupil, geom = 'line')
p