Pre-prepared plots of PupillometryR data
Source:R/plot_pupil_data.R
plot.PupillometryR.Rd
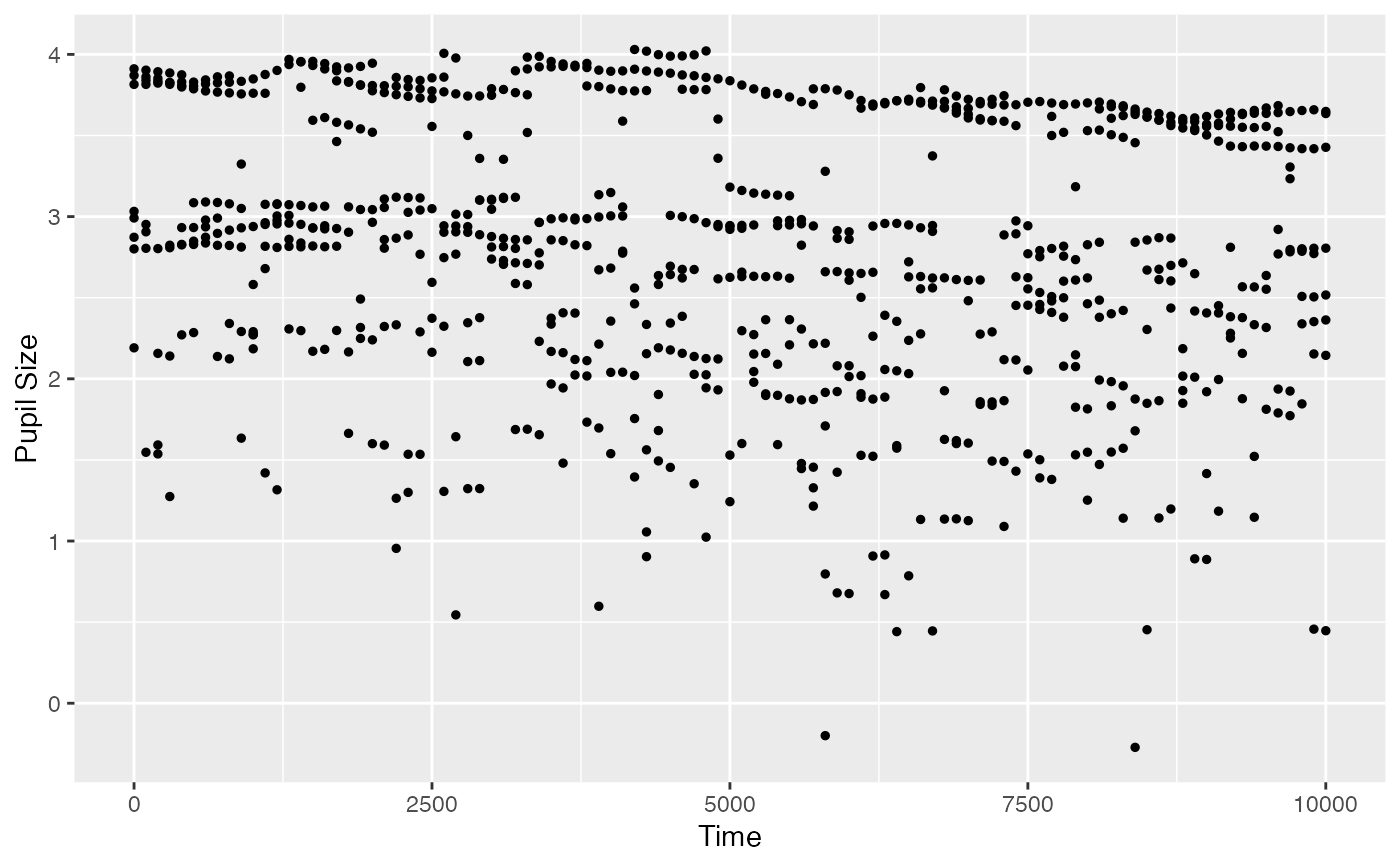
The plot functions are designed to run with just data and pupil selections, with some additional options for fun with plotting. This allows to see raw data as points, grouped by either subject or condition.
# S3 method for PupillometryR
plot(
  x,
  pupil,
  group = c("none", "condition", "subject"),
  geom = c("point", "line", "pointrange"),
  model = NULL,
  ...
)
Arguments
- x
-
A PupillometryR dataframe
- pupil
-
Column name of pupil data to be plotted
- group
-
What to group the data by (none, condition, or subject)
- geom
-
Geom to pass to ggplot. Either point, line, or pointrange.
- model
-
Optional argument to plot agains a fitted model
- ...
-
Ignored
Value
A ggplot object
Examples
Sdata <- make_pupillometryr_data(data = pupil_data,
subject = ID,
trial = Trial,
time = Time,
condition = Type)
Sdata2 <- downsample_time_data(data = Sdata,
pupil = LPupil,
timebin_size = 100,
option = 'median')
#> Calculating median pupil size in each timebin
p <- plot(Sdata2, pupil = LPupil, group = 'subject')
p